
Microbiome Community Analysis
Community AnalysisCommunity analysis of microbiome census data — an OTU/ASV abundance table, a taxonomy table and a sample-metadata table — for composition, alpha and beta diversity, ordination and co-occurrence. The three tables are the standard output of any amplicon or metagenomics pipeline (QIIME 2, DADA2, mothur, USEARCH/VSEARCH, MetaPhlAn); bring them from whichever one you ran. [1]
How to Obtain Output Model File
Below is a brief workflow the team ran to obtain the output model examples we present on the tools page.
Input
An OTU/ASV feature table + a taxonomy table + a sample-metadata table (CSV/TSV) — exported from QIIME 2, DADA2, mothur or any pipeline; e.g. the bundled CARBOM example (18S metabarcoding, 205 taxa × 54 samples)
Output
Three CSV/TSV tables uploaded to IntMeta — an OTU/ASV abundance table (taxa × samples), a taxonomy table (taxon id + ranks such as Domain … Genus), and a sample-metadata table (sample + variables)
conda install -c bioconda bioconductor-phyloseq
Export the feature table and taxonomy from your QIIME 2 artifacts (.qza) and convert the feature table to TSV. The sample-metadata TSV you already use in QIIME 2 is the third file, unchanged. See QIIME 2 — exporting data.
- 1
Export the feature table and convert to TSV
qiime tools export --input-path table.qza --output-path exported/
biom convert -i exported/feature-table.biom -o otu_table.tsv --to-tsv
Delete the leading "# Constructed from biom file" comment line from otu_table.tsv before upload, so the header row starts with the taxon-id column.
- 2
Export the taxonomy
qiime tools export --input-path taxonomy.qza --output-path exported/
Produces exported/taxonomy.tsv (Feature ID + Taxon + Confidence). Optionally split the Taxon string into one column per rank.
- 3
Use your sample metadata as-is
# sample-metadata.tsv — first column = sample id, remaining columns = variables
The same metadata TSV you passed to QIIME 2 is the third upload file.
Materials Used
Sample Output Files
Download the output files used in the tool page demos. You can upload these directly to IntMeta to explore the visualizations.
Single & Comparison
Charts Reference
Detailed descriptions for all 6 visualizations generated by Microbiome Community Analysis in IntMeta.
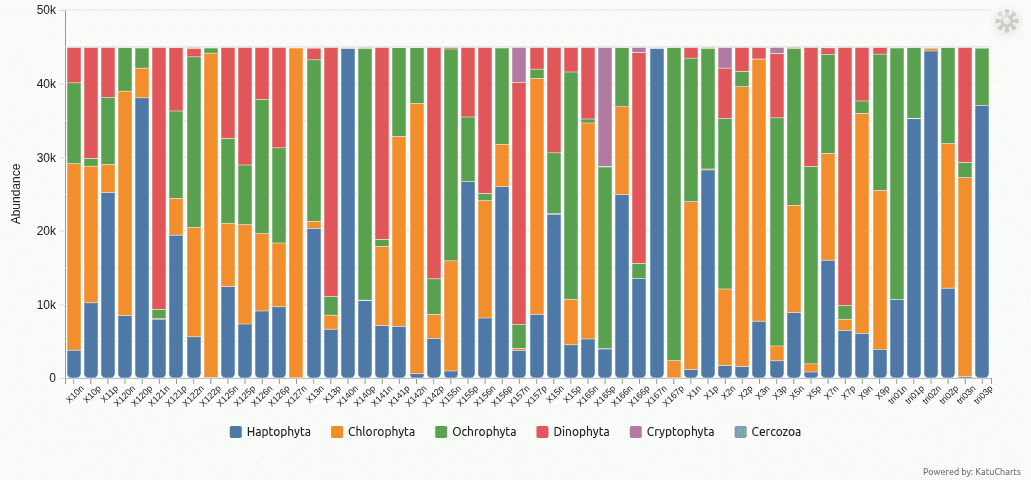
composition
Per-sample stacked bar chart of relative abundance at a chosen taxonomic rank. Each bar is one sample — or a set of samples merged by a metadata variable — split into coloured segments for the most abundant taxa, revealing how community composition shifts across sites, depths or fractions.
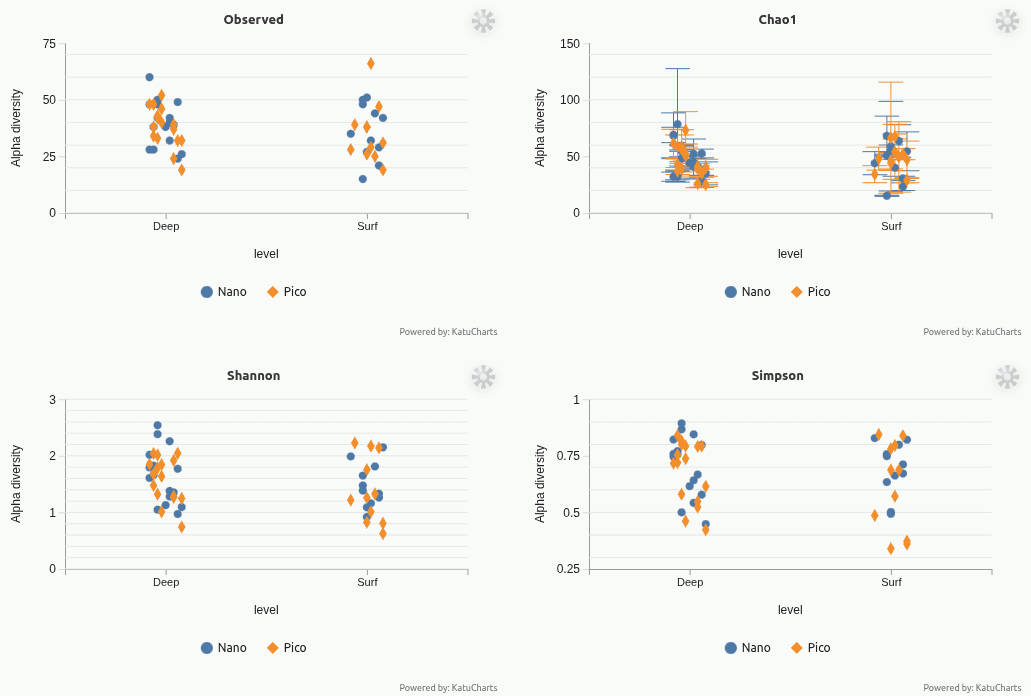
alpha-diversity
Within-sample diversity as one point per sample with a confidence interval, faceted by measure: Observed richness, Chao1 (with its standard error drawn as capped error bars), Shannon entropy and the Simpson index. Points sit along a chosen categorical metadata variable and are coloured by a second one, so treatment or depth effects on diversity stand out.
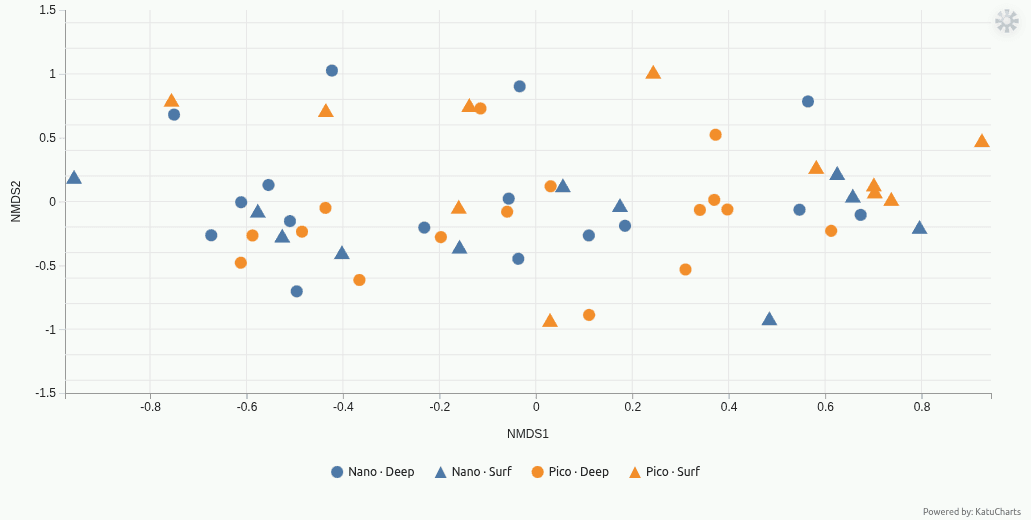
ordination-samples
Beta-diversity ordination of samples (NMDS or PCoA) computed on a Bray-Curtis or Jaccard distance matrix. Each point is a sample, coloured and shaped by metadata variables; nearby points have similar communities. Optional 95% confidence ellipses summarise groups.
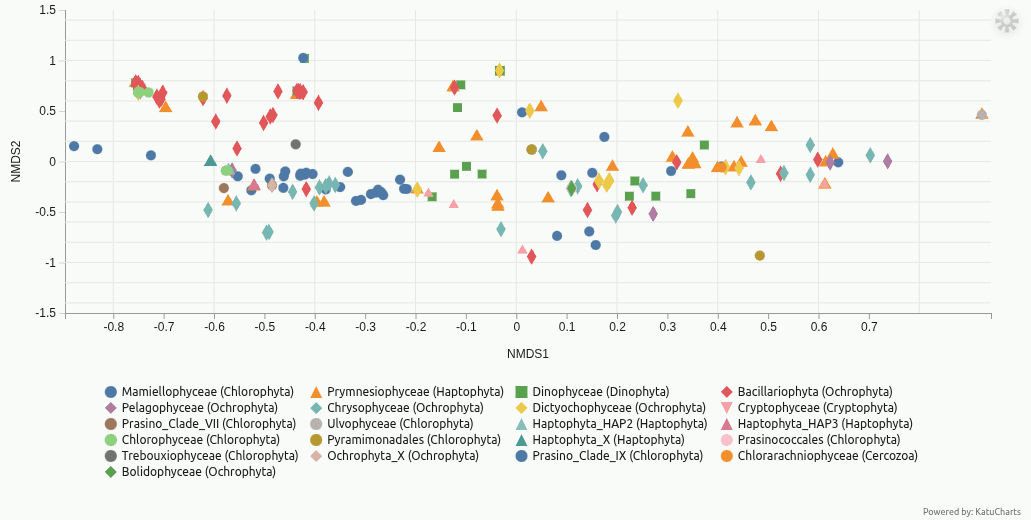
ordination-taxa
The same ordination projected onto taxa: each point is a taxon placed by its weighted-average score, coloured by one rank and shaped by another. Highlights which taxa drive the separation between samples and how higher ranks cluster in community space.
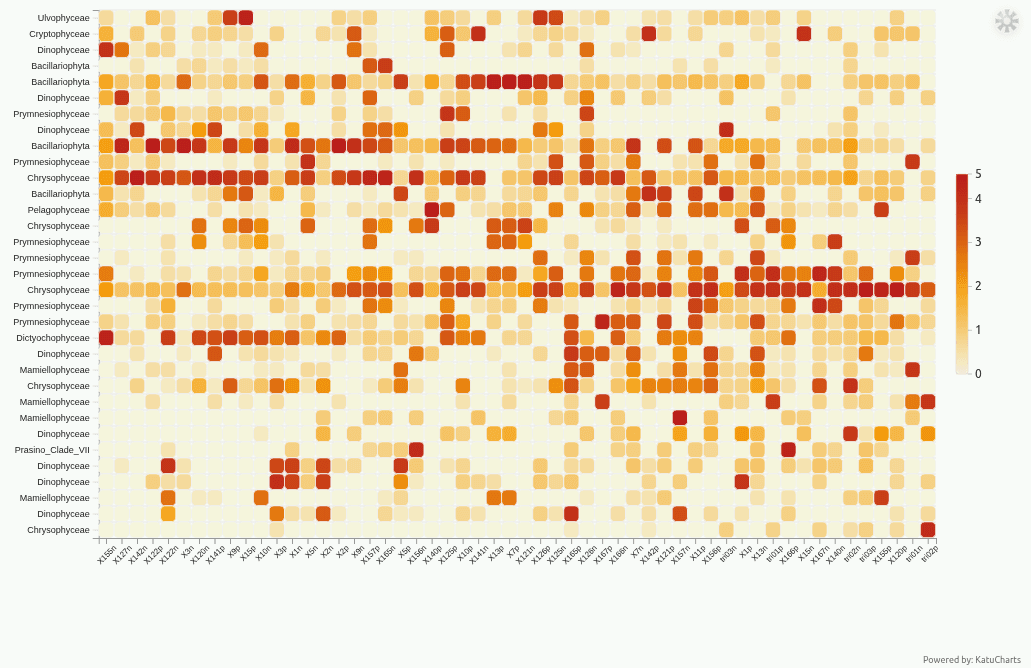
heatmap
Abundance heatmap of the most abundant taxa (rows) across samples (columns), with rows and columns ordered by the ordination so co-occurring taxa and similar samples sit together. Cell colour encodes abundance on a beige-to-red scale; an abundance threshold controls how many taxa are shown.
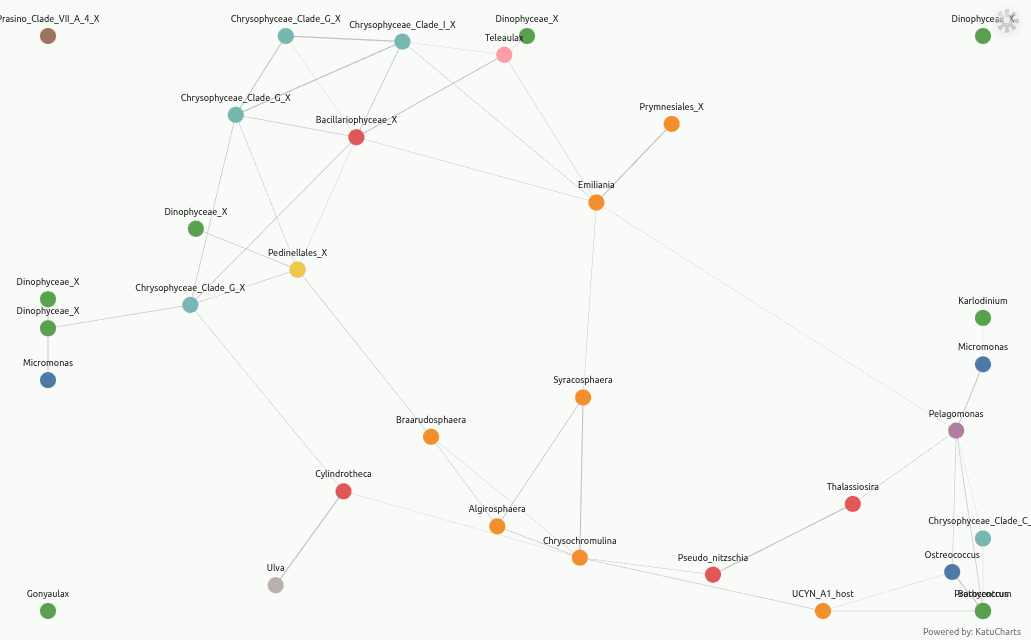
network
Co-occurrence network of the abundant taxa: nodes are taxa (coloured by a chosen rank, labelled by another) linked when their abundance profiles are similar — distance below an adjustable threshold. Edge width scales with closeness, nodes are draggable, and labels are spread apart automatically to stay readable.