SemiBin2
Metagenomic BinningSemiBin2 is a self-supervised deep learning method for metagenomic binning. It uses contrastive learning with data augmentation to train sample-specific models without requiring reference genomes, enabling accurate binning even for novel environments. [1]
How to Obtain Output Model File
Below is a brief workflow the team ran to obtain the output model examples we present on the tools page.
Input
Assembled contigs (FASTA) + sorted BAM alignment file(s)
Output
FASTA bins (.fa.gz) + TSV summary with per-bin metrics: filename, total bp, contig count, N50, L50
conda install -c bioconda semibin
Docker image: quay.io/biocontainers/semibin:2.2.1--pyhdfd78af_0
Sample 1 gut microbiome (3 samples from PRJNA795985, 1M read pairs each) co-assembled with Assembly and binned with SemiBin2 v2.2.1 in self-supervised mode, producing 38 bins.
- 1
Download 3 samples from PRJNA795985
for SRR in SRR17531757 SRR17531762 SRR17531772; do fastq-dump --split-files --gzip -X 1000000 --outdir reads/ $SRR; done
Same co-assembly as VAMB — reuses the same reads. Downloads 1M read pairs per sample (~70 MB compressed each).
- 2
Co-assemble all samples with MEGAHIT
megahit -1 reads/SRR17531757_1.fastq.gz,reads/SRR17531762_1.fastq.gz,reads/SRR17531772_1.fastq.gz -2 reads/SRR17531757_2.fastq.gz,reads/SRR17531762_2.fastq.gz,reads/SRR17531772_2.fastq.gz -o assembly --min-contig-len 1500 -t 8 --presets meta-sensitive
Produces 14,934 contigs (≥1,500 bp). If already done for VAMB, reuse the same assembly.
- 3
Map each sample to contigs
for SRR in SRR17531757 SRR17531762 SRR17531772; do minimap2 -ax sr -t 8 assembly/final.contigs.fa reads/${SRR}_1.fastq.gz reads/${SRR}_2.fastq.gz | samtools sort -@ 4 -o bams/${SRR}.sorted.bam && samtools index bams/${SRR}.sorted.bam; done - 4
Run SemiBin2 self-supervised binning
SemiBin2 single_easy_bin -i assembly/final.contigs.fa -b bams/SRR17531757.sorted.bam bams/SRR17531762.sorted.bam bams/SRR17531772.sorted.bam -o semibin2_out --self-supervised -m 1500 -t 8
Uses single_easy_bin with multiple BAMs for co-abundance. Self-supervised mode trains a sample-specific model (~38 min on CPU). Produces 38 bins after HMM-based reclustering.
recluster_bins_info.tsv to IntMetaMaterials Used
Charts Reference
Detailed descriptions for all 10 visualizations generated by SemiBin2 in IntMeta.
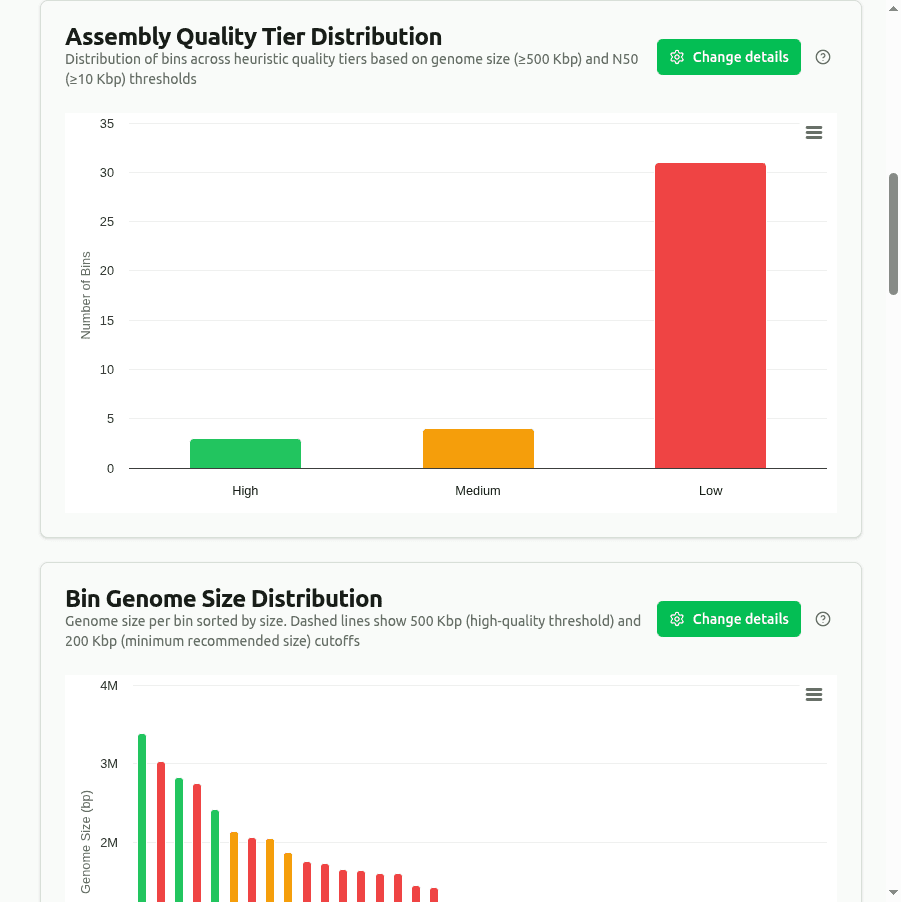
quality-tier-distribution
Pie chart of bins classified into heuristic quality tiers based on assembly metrics: High (≥500 Kbp genome + N50 ≥10 Kbp), Medium (≥200 Kbp + N50 ≥5 Kbp), Low (rest). Note: these are assembly-metric heuristics, not MIMAG quality tiers — no completeness/contamination is assessed.

genome-size-distribution
Bar chart of total_bp (genome size) per bin, sorted by size. Dashed reference lines at 500 Kbp (high-quality threshold) and 200 Kbp (minimum recommended size) help visually separate quality tiers.

n50-assembly-quality
Bar chart of the N50 contiguity metric per bin — half of the bin's total base pairs are in contigs of this length or longer. Higher N50 means fewer, longer contigs and less fragmentation. Colored by quality tier.

n50-vs-genome-size
Scatter plot where X = total_bp (genome size) and Y = N50, colored by quality tier. Bins in the top-right have both large genomes and high contiguity — the best candidates for downstream analysis like gene annotation.

contigs-per-bin
Bar chart of num_contigs per bin, colored by quality tier. Fewer contigs generally indicates a less fragmented, higher-quality assembly. Bins with very high contig counts may need further refinement.

l50-vs-contigs
Scatter plot of L50 (the minimum number of contigs needed to cover 50% of the bin's genome) vs total num_contigs. Lower L50 relative to total contigs means the assembly is dominated by a few long contigs — better contiguity.

assembly-metrics-heatmap
Heatmap of min-max normalized assembly metrics (total_bp, num_contigs, N50, L50, average contig length) across the top bins. Each metric is scaled 0–1 within its column; darker cells = higher relative values. Quick quality overview.

comp-quality-tiers
Grouped bar chart comparing the distribution of heuristic quality tiers (High / Medium / Low based on genome size and N50 thresholds) across samples. Shows which sample yielded more high-quality SemiBin2 bins.

comp-genome-size
Box plot or grouped bar chart comparing the genome size (total_bp) distribution of SemiBin2 bins across samples. Useful for detecting systematic differences in MAG recovery between samples.

comp-n50-distribution
Box plot or bar chart comparing the N50 contiguity metric across samples. Higher N50 values indicate less fragmented assemblies — samples with consistently high N50 bins suggest better sequencing depth or simpler community composition.