Kaiju
Taxonomic ClassificationKaiju is a protein-level metagenomic classifier that translates DNA reads into amino acid sequences and matches them against a reference protein database using the Burrows-Wheeler transform (BWT). [1]
How to Obtain Output Model File
Below is a brief workflow the team ran to obtain the output model examples we present on the tools page.
Input
FASTQ/FASTA files (single-end or paired-end reads)
Output
Tab-separated classification with taxon IDs, plus summary tables at each taxonomic rank
conda install -c bioconda kaiju
Docker image: nanozoo/kaiju:latest
Sample 1 marine virome reads classified with Kaiju against the NCBI RefSeq viral proteins Database.
- 1
Download reads from NCBI SRA
prefetch DRR361653 && fasterq-dump DRR361653 -O /data --split-files && gzip /data/DRR361653_*.fastq
- 2
Download Kaiju viral protein database
kaiju-makedb -s viruses
Downloads NCBI RefSeq viral protein sequences and builds FM-index.
- 3
Run Kaiju classification
kaiju -t nodes.dmp -f kaiju_db_viruses.fmi -i DRR361653_1.fastq.gz -j DRR361653_2.fastq.gz -o kaiju_raw.tsv -z 12
- 4
Add taxon names
kaiju-addTaxonNames -t nodes.dmp -n names.dmp -i kaiju_raw.tsv -o kaiju_output.tsv -r superkingdom,phylum,class,order,family,genus,species -u
kaiju_output.tsv to IntMetaMaterials Used
Charts Reference
Detailed descriptions for all 12 visualizations generated by Kaiju in IntMeta.
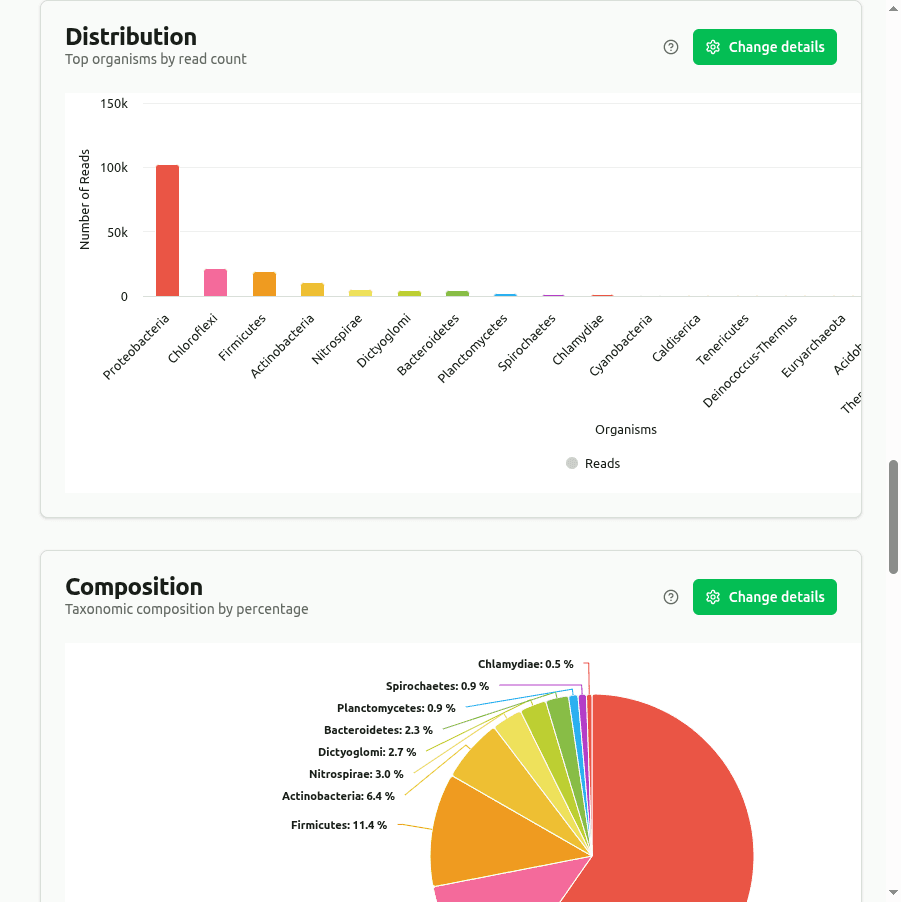
distribution
Bar chart of the top organisms ranked by read count from Kaiju's protein-level classification. Because Kaiju translates reads to amino acids before matching, it can detect divergent organisms that nucleotide k-mer methods miss.
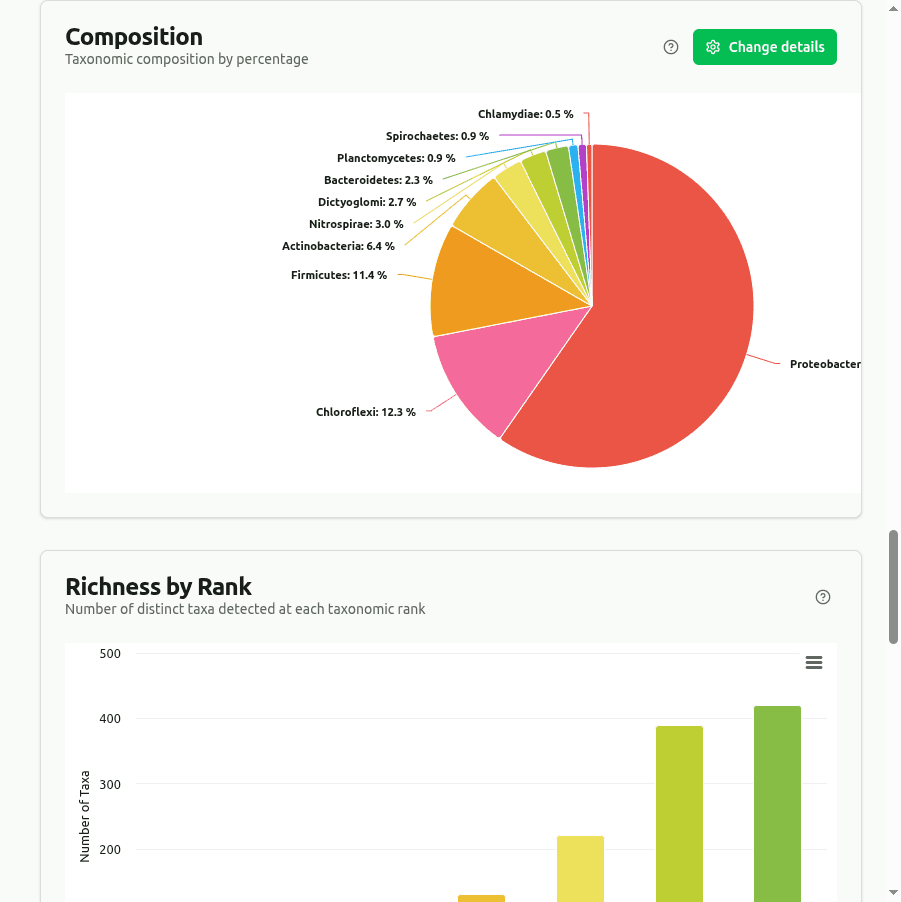
composition
Pie/donut chart showing the top taxa as a percentage of their combined read count at the selected rank, derived from Kaiju's BWT protein-level assignments.
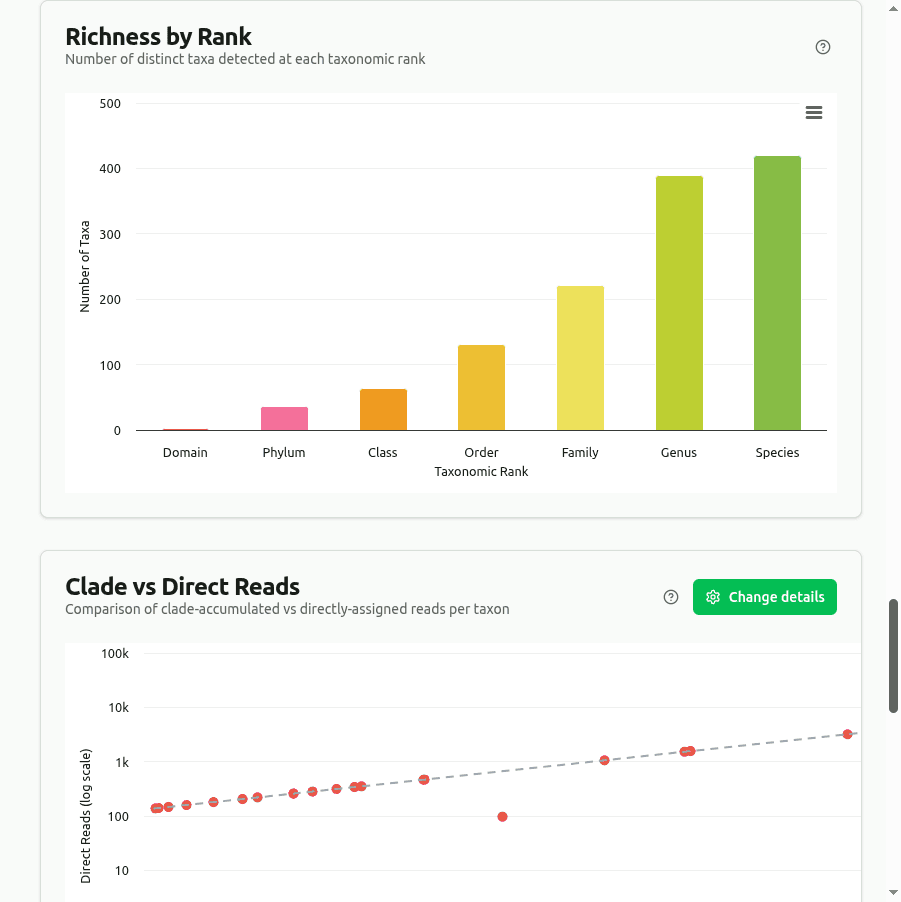
richness
Counts every distinct organism with at least one assigned read at each major rank (Domain through Species). Protein-level classification tends to detect additional divergent or novel taxa compared to DNA k-mer tools.
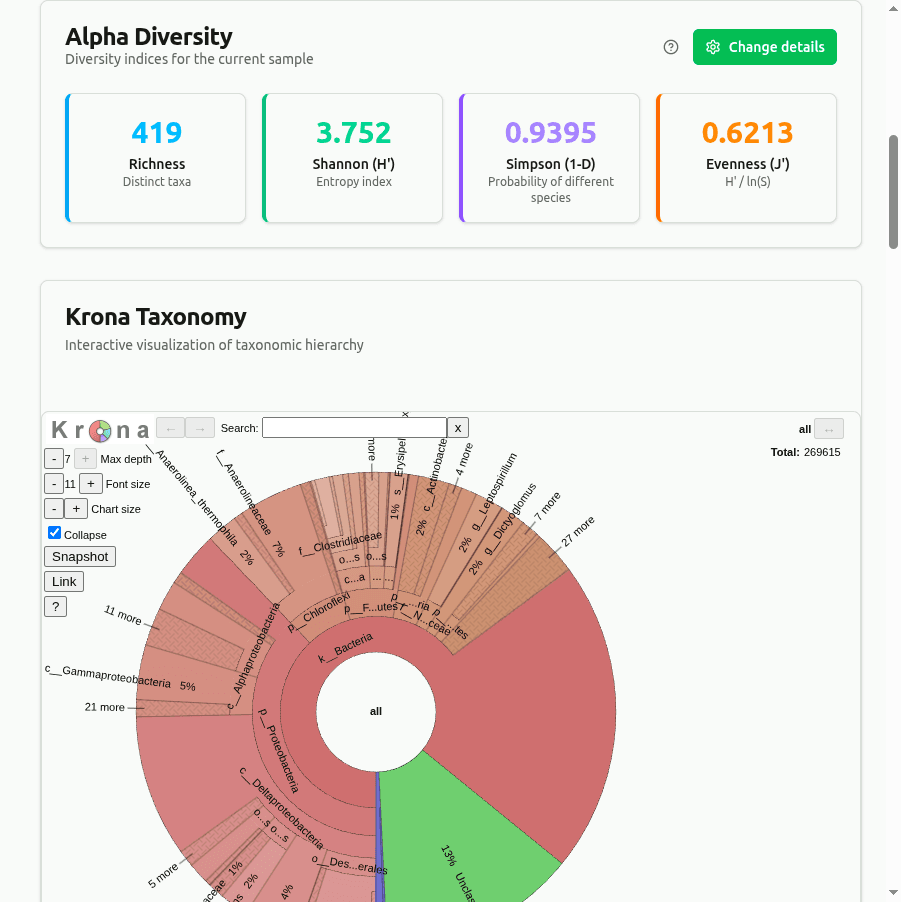
diversity
Alpha diversity indices computed from per-taxon read-count proportions: Shannon H = −Σ(pᵢ · ln pᵢ), Simpson D = 1 − Σ(nᵢ(nᵢ−1))/(N(N−1)), and Pielou's evenness J = H / ln(richness). Measures community richness and evenness from Kaiju abundance data.
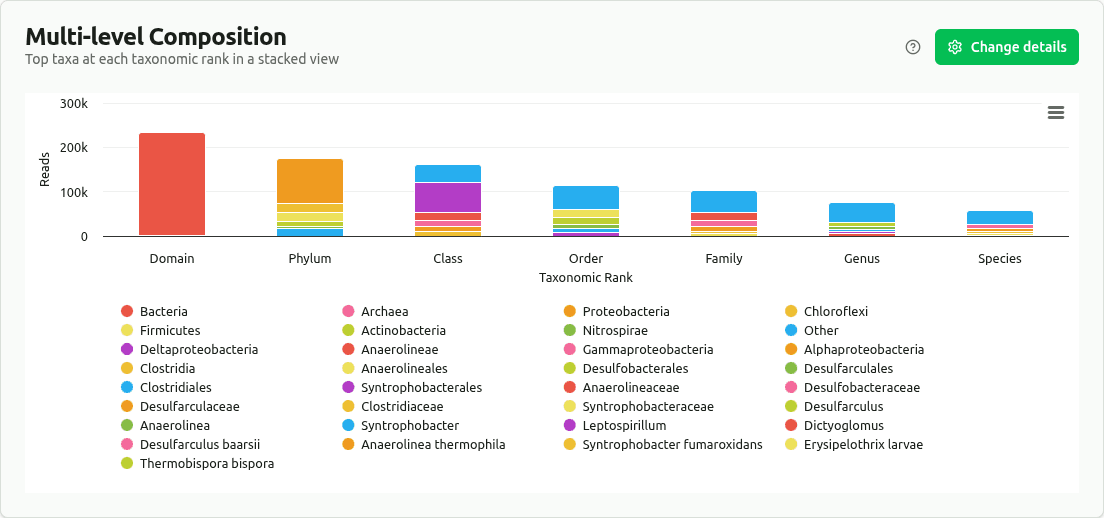
multilevel-composition
Stacked bar chart with the top taxa (by read count) at each major rank; remaining taxa grouped as 'Other'. Reveals compositional shifts from Phylum to Species level.
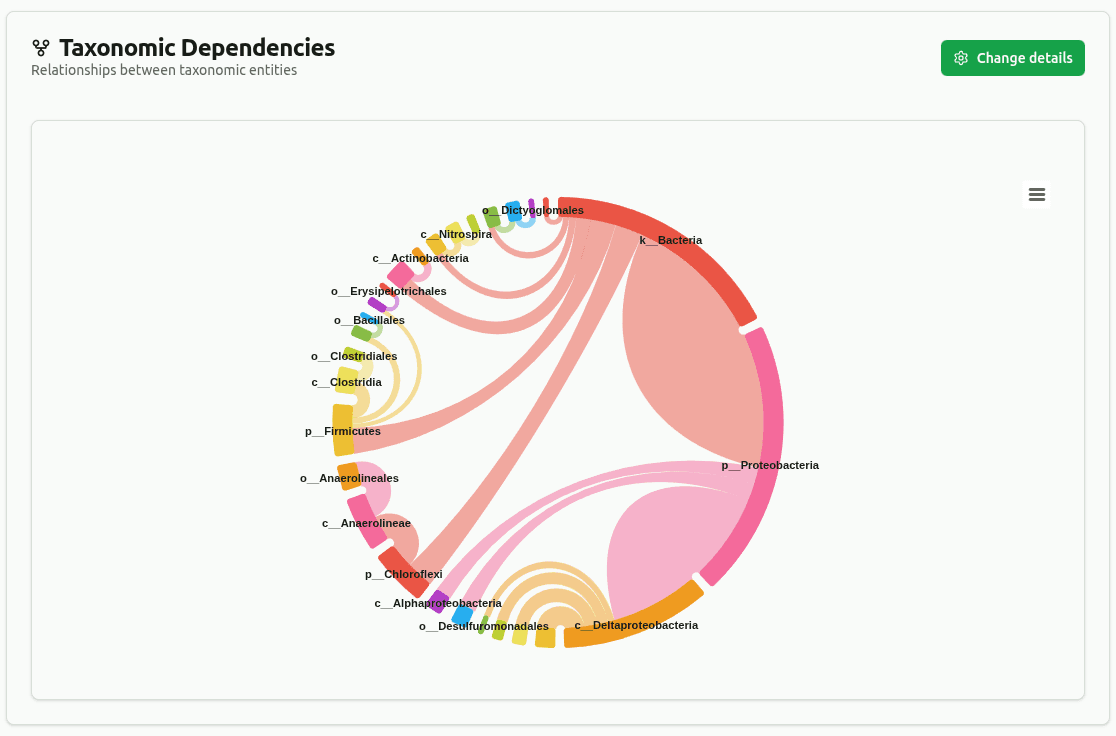
dependency-wheel
Chord diagram linking parent to child taxa across ranks from the Kaiju lineage output. Connection thickness is proportional to shared read count; edges below the minimum coverage threshold are filtered.
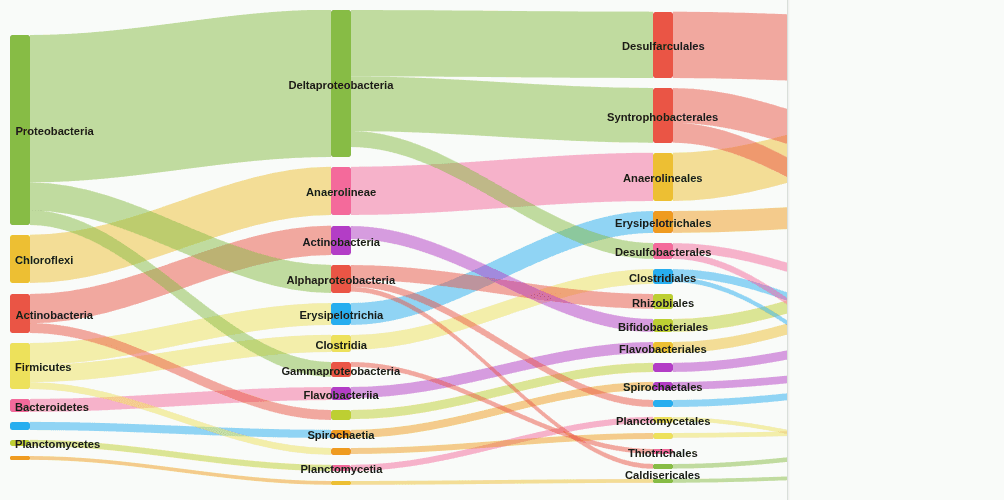
sankey-flow
Sankey flow diagram showing how reads distribute from higher to lower taxonomic ranks through the Kaiju classification hierarchy. Band width equals read count; low-coverage edges are removed.
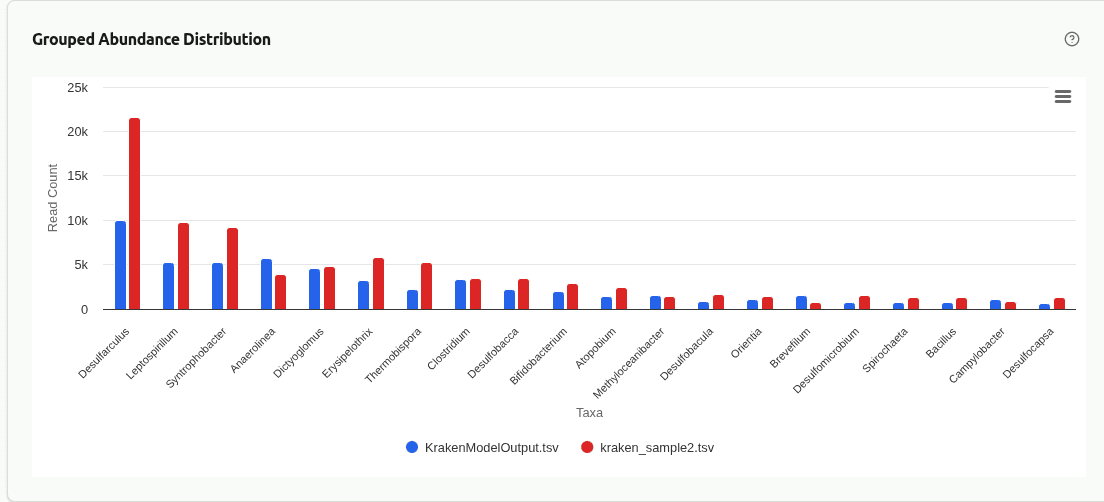
comp-grouped-abundance
Grouped bar chart placing the top taxa from each sample side by side at the selected rank. Each group contains one bar per sample, colored by sample identity, enabling direct visual comparison of absolute read counts for the same organism across Kaiju-classified samples.
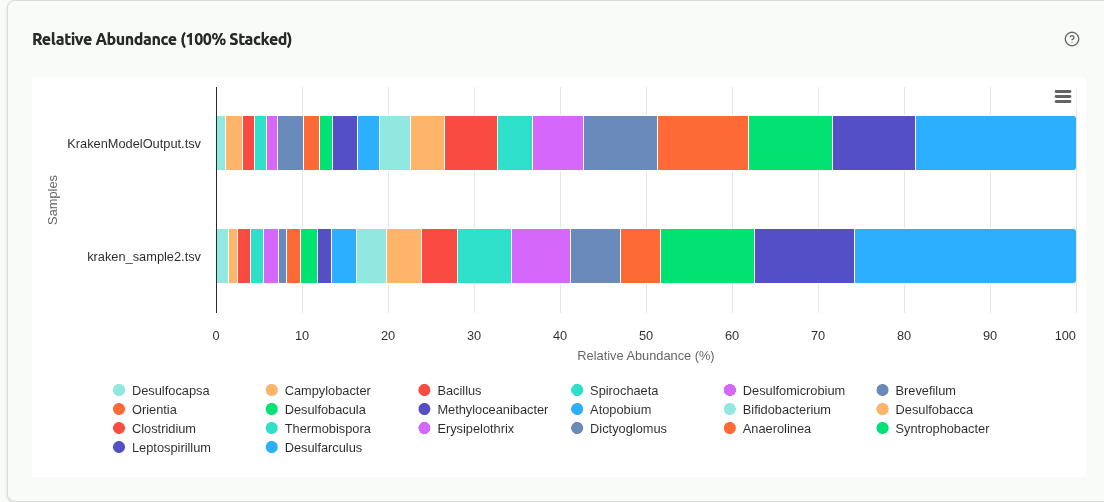
comp-relative-abundance
100% stacked bar chart where each bar represents one sample and segments show the proportional contribution of each taxon. Useful for comparing community composition when samples have very different sequencing depths, since all bars are normalized to the same height.

comp-abundance-heatmap
Color-matrix heatmap with taxa on one axis and samples on the other. Cell color intensity is proportional to read abundance at the selected rank. Hierarchical clustering on both axes groups similar samples and co-occurring taxa together.
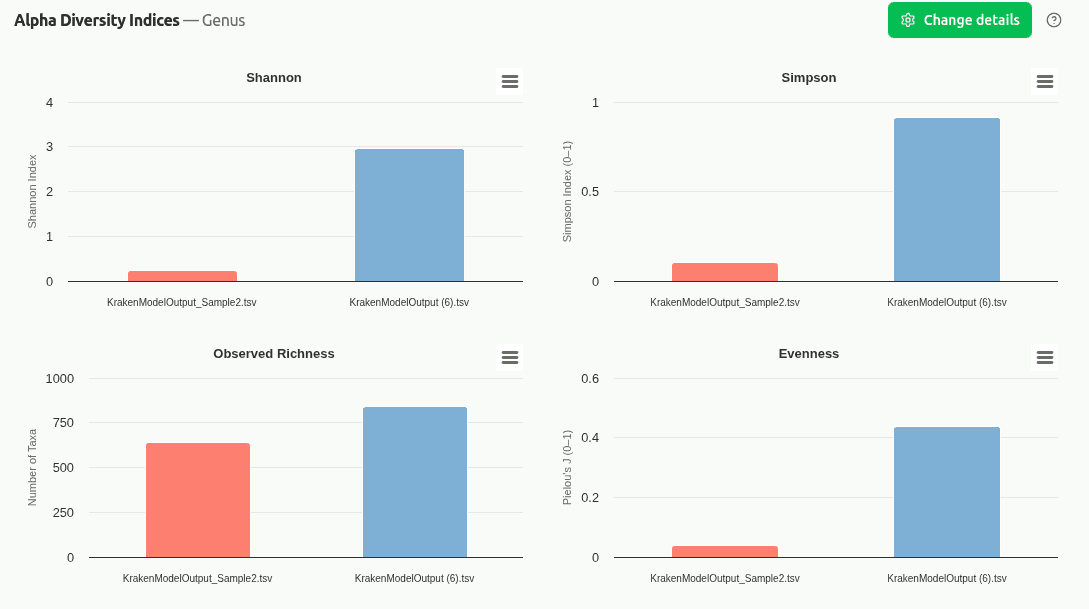
comp-diversity-indices
Multi-panel chart displaying Shannon entropy, Simpson diversity, Observed Richness, and Pielou's Evenness for each sample on its own y-axis scale. Enables quick cross-sample comparison of alpha diversity without scale distortion.
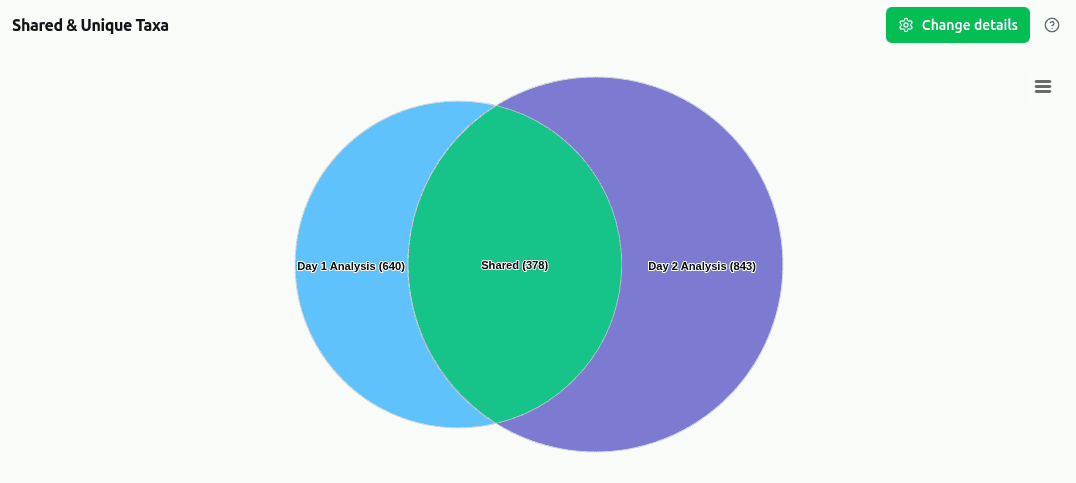
comp-shared-taxa
Venn diagram (2–3 samples) showing the count of taxa that are shared between all samples versus taxa exclusive to each individual sample. Computed at the selected taxonomic rank using presence/absence of reads ≥ 1.