Kraken2
Taxonomic ClassificationKraken2 is an ultrafast k-mer based taxonomic sequence classifier that assigns taxonomic labels to short DNA reads by examining the k-mers within a read and querying a database with those k-mers. [1]
How to Obtain Output Model File
Below is a brief workflow the team ran to obtain the output model examples we present on the tools page.
Input
FASTQ/FASTA files (single-end or paired-end reads)
Output
Tab-separated report with taxonomic counts at each rank, plus per-read classification file
conda install -c bioconda kraken2
Docker image: staphb/kraken2:latest
Sample 1 human gut metagenome (SRR14092160, 5.5M read pairs) classified with Kraken2 against the Database.
- 1
Download reads from NCBI SRA
prefetch SRR14092160 && fasterq-dump SRR14092160 -O /data --split-files && gzip /data/SRR14092160_*.fastq
Human gut metagenome, pre-VRE colonization timepoint (Day -9). Illumina paired-end, 5.5M read pairs.
- 2
Download PlusPF-8 database
wget https://genome-idx.s3.amazonaws.com/kraken/k2_pluspf_08_GB_20251015.tar.gz && mkdir -p kraken2_db && tar xzf k2_pluspf_08_GB_20251015.tar.gz -C kraken2_db/
~5.6 GB download, 7 GB extracted. Pre-built indexes available at https://benlangmead.github.io/aws-indexes/k2.
- 3
Run Kraken2 classification
kraken2 --db kraken2_db --paired --gzip-compressed --threads 12 --report kraken2_output.tsv --output /dev/null SRR14092160_1.fastq.gz SRR14092160_2.fastq.gz
52.29% classified. Diverse community dominated by Bacillota.
kreport.tsv to IntMetaMaterials Used
Charts Reference
Detailed descriptions for all 13 visualizations generated by Kraken2 in IntMeta.
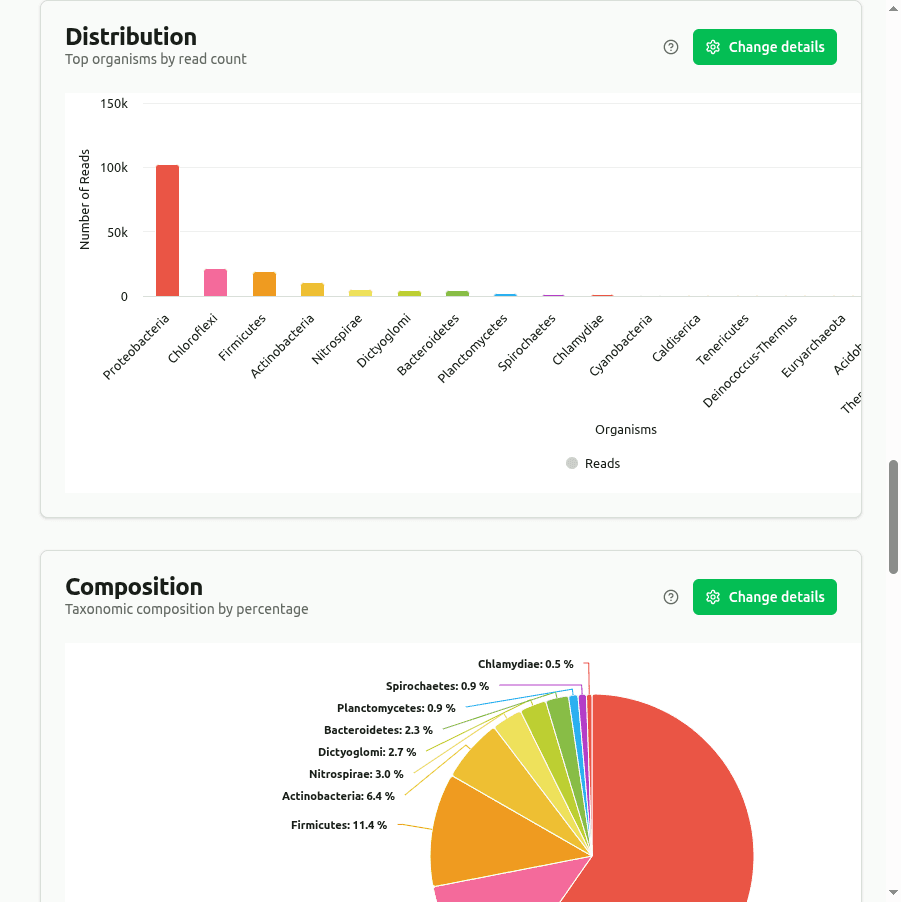
distribution
Bar chart ranking the top organisms by clade read count (reads assigned to the taxon plus all its descendants) from the Kraken2 report. Provides a quick overview of the most abundant taxa at the selected rank.
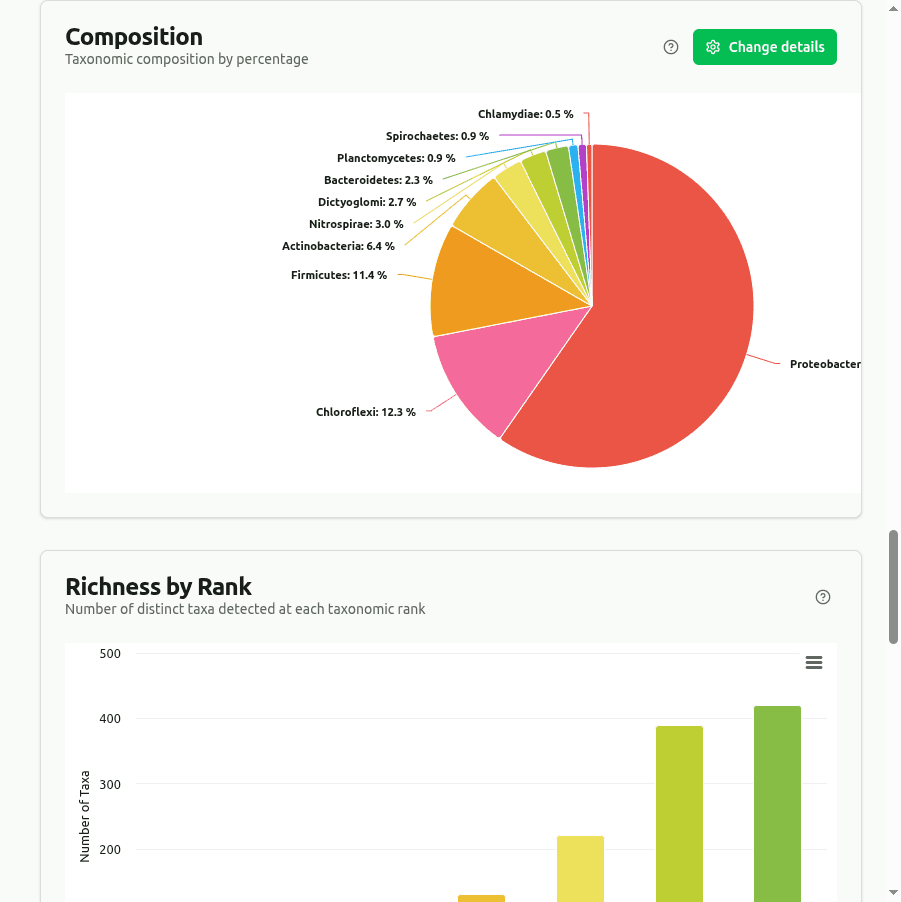
composition
Pie/donut chart showing the top taxa as a percentage of their combined read count at the selected rank. Each slice is computed as (taxon clade reads / sum of displayed clade reads) × 100.
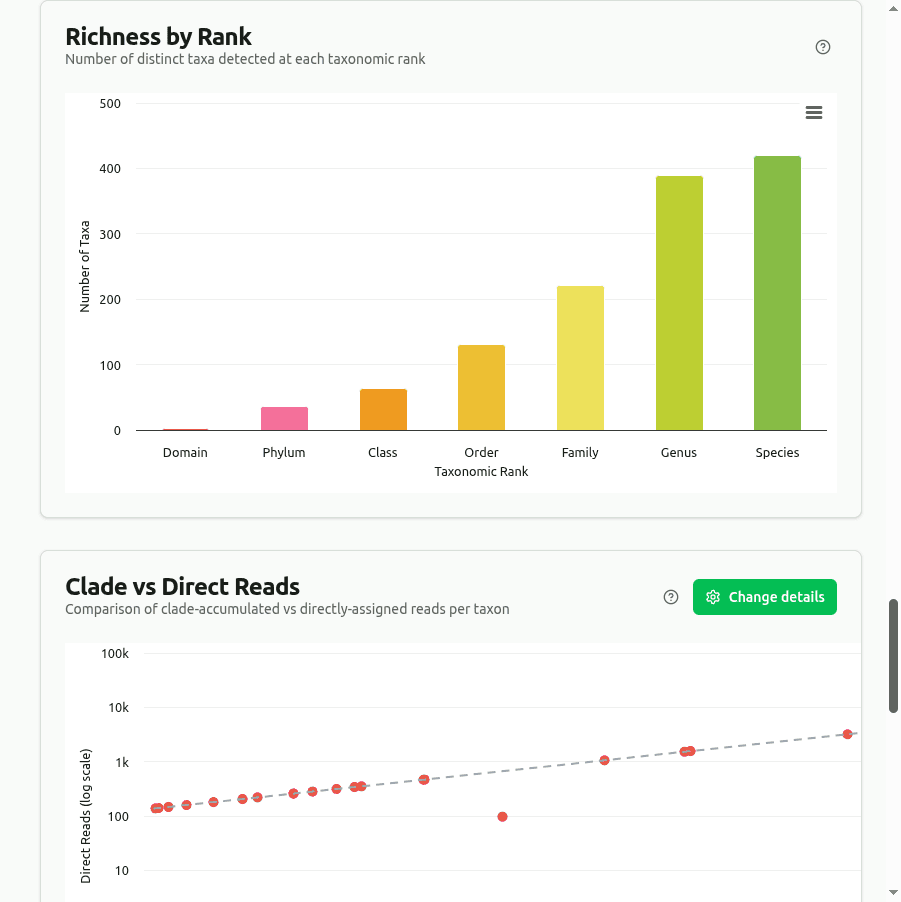
richness
Counts every unique organism with at least one clade read at each major rank (Domain through Species). The bar height is the raw distinct-taxon count — not abundance-weighted — so a taxon with 1 read counts the same as one with 1 million.
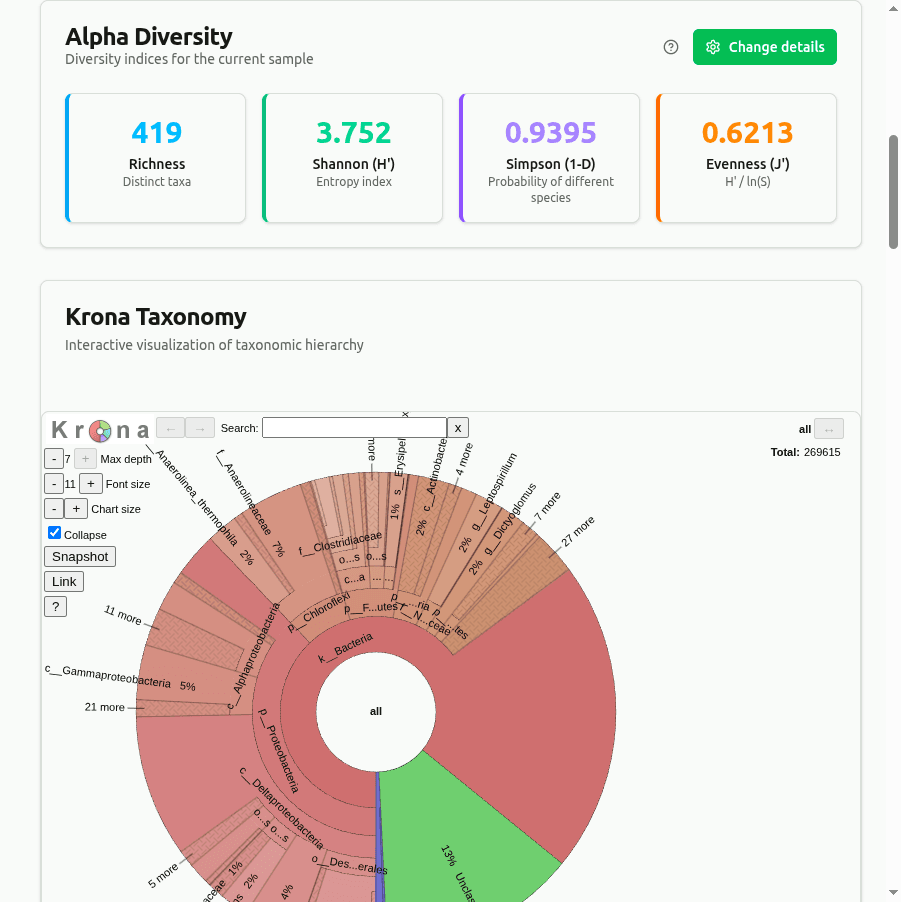
diversity
Alpha diversity indices computed from per-taxon clade-read proportions at the selected rank. Shannon H = −Σ(pᵢ · ln pᵢ), Simpson D = 1 − Σ(nᵢ(nᵢ−1))/(N(N−1)), and Pielou's evenness J = H / ln(richness). Higher Shannon entropy indicates a more even community.
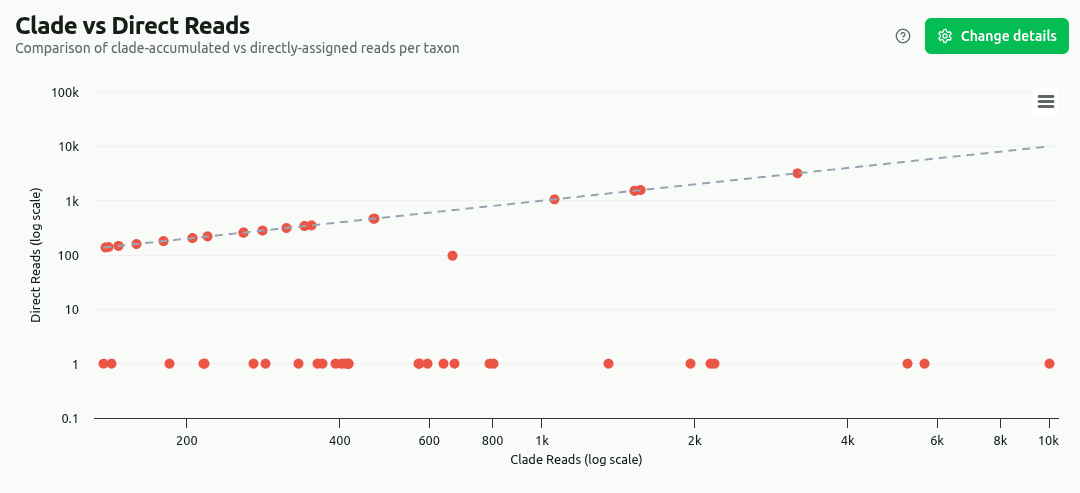
clade-vs-direct
Side-by-side comparison of clade reads (taxon + all descendants) versus directly-assigned reads for the top taxa. Includes a specificity ratio (direct / clade): values near 1.0 mean most reads map directly to that taxon, while values near 0 mean abundance is driven by sub-taxa.
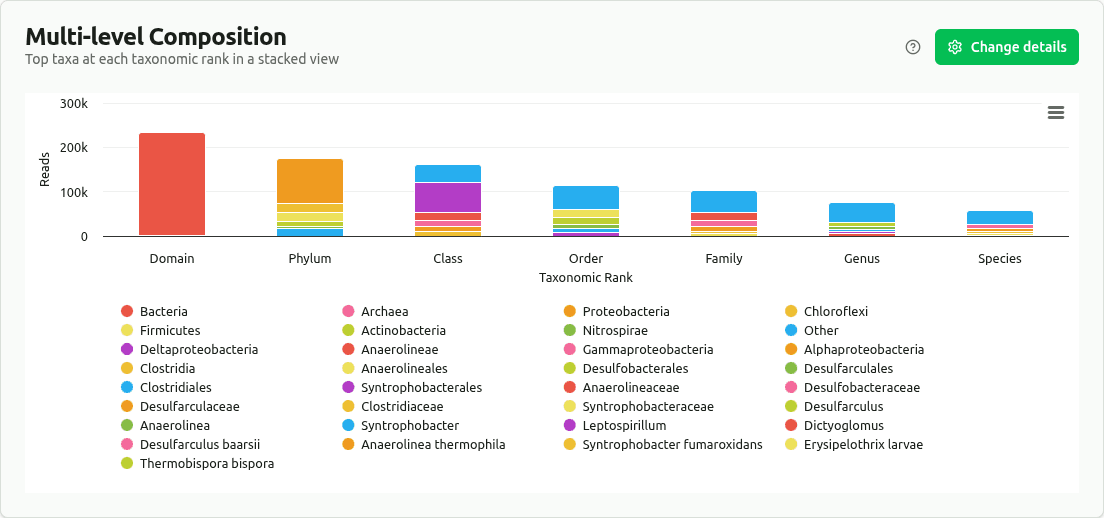
multilevel-composition
Stacked bar chart displaying the top taxa (by clade reads) at each major rank, with remaining taxa grouped as 'Other'. Reveals how community composition shifts as classification resolution increases from Domain to Species.
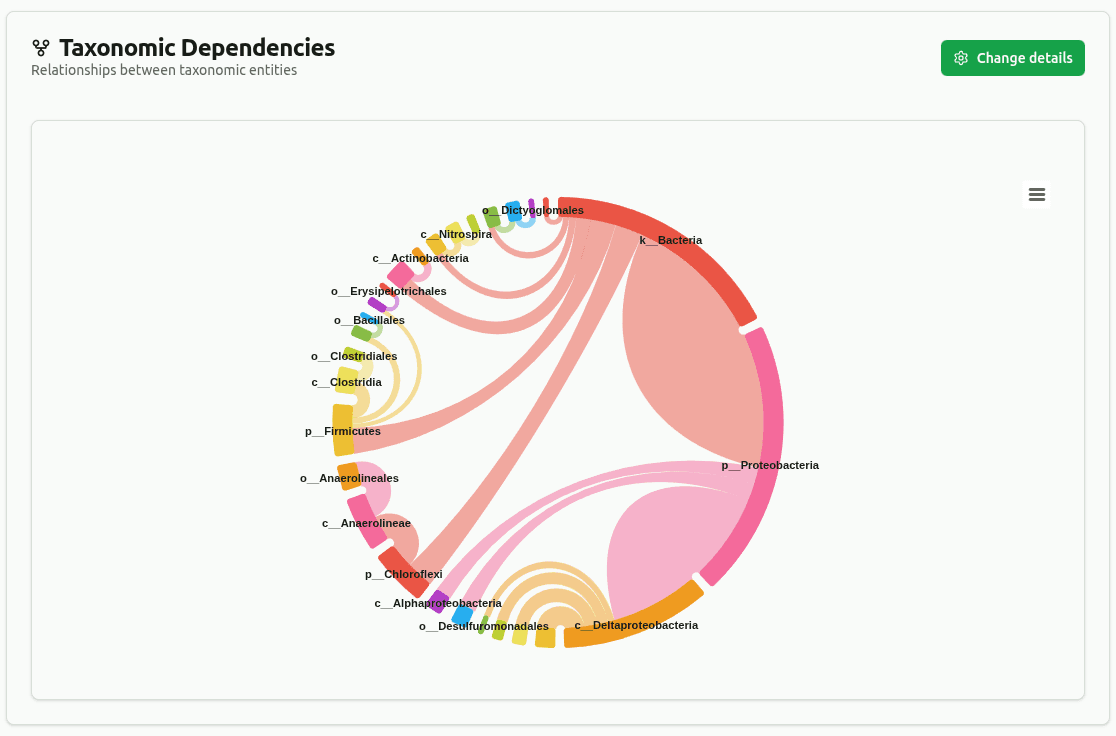
dependency-wheel
Chord diagram connecting parent taxa to their child taxa across ranks (up to the selected max rank). Connection thickness is proportional to shared clade-read count. Edges below a minimum coverage threshold (default 5% of total reads) are filtered out.
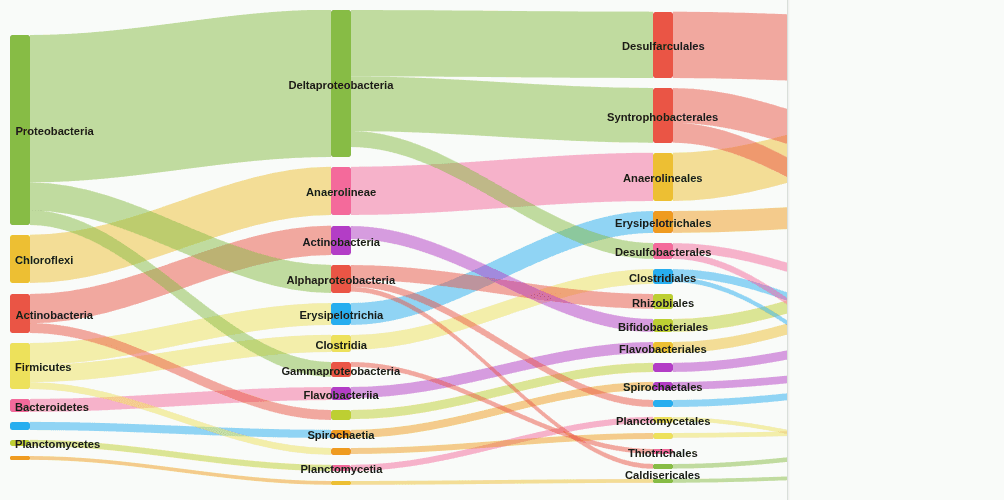
sankey-flow
Sankey flow diagram tracing how reads distribute from the start rank (default: Domain) to the end rank (default: Genus). Each band's width equals the read count flowing from a parent taxon to a child taxon. Edges below a minimum coverage threshold (default 5%) are removed to reduce clutter.
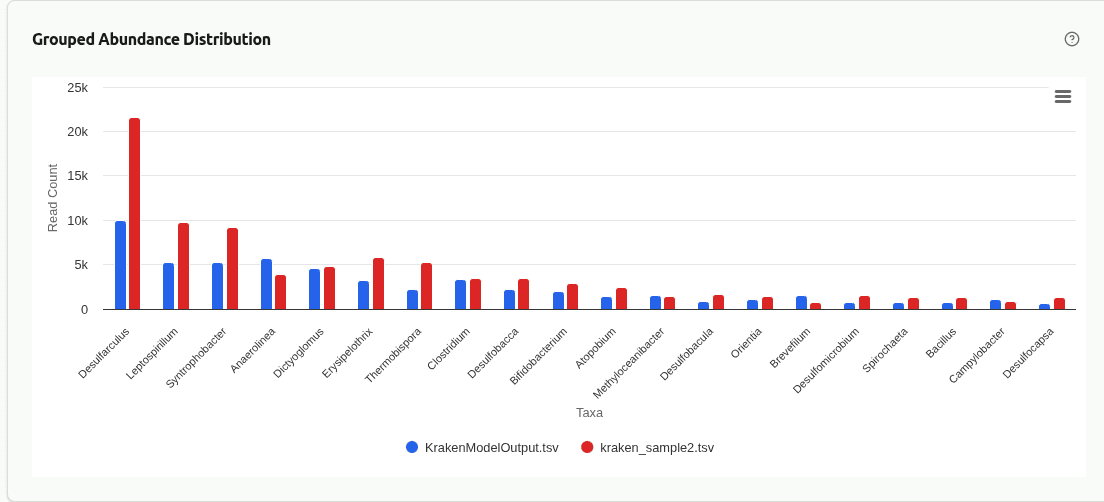
comp-grouped-abundance
Grouped bar chart placing the top taxa from each sample side by side at the selected rank. Each group contains one bar per sample, colored by sample identity, enabling direct visual comparison of absolute clade-read counts for the same organism across samples.
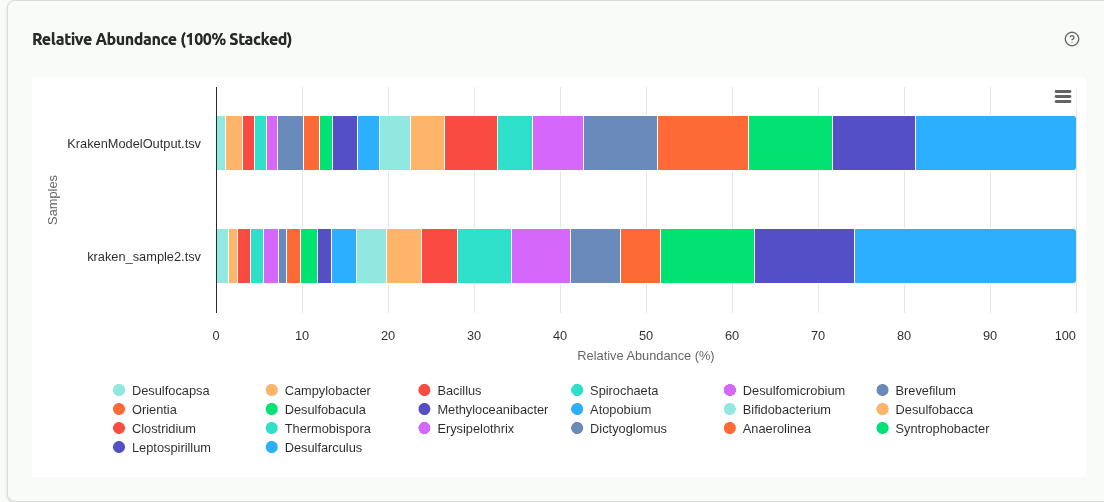
comp-relative-abundance
100% stacked bar chart where each bar represents one sample and segments show the proportional contribution of each taxon. Useful for comparing community composition when samples have very different sequencing depths, since all bars are normalized to the same height.

comp-abundance-heatmap
Color-matrix heatmap with taxa on one axis and samples on the other. Cell color intensity is proportional to clade-read abundance at the selected rank. Hierarchical clustering on both axes groups similar samples and co-occurring taxa together.
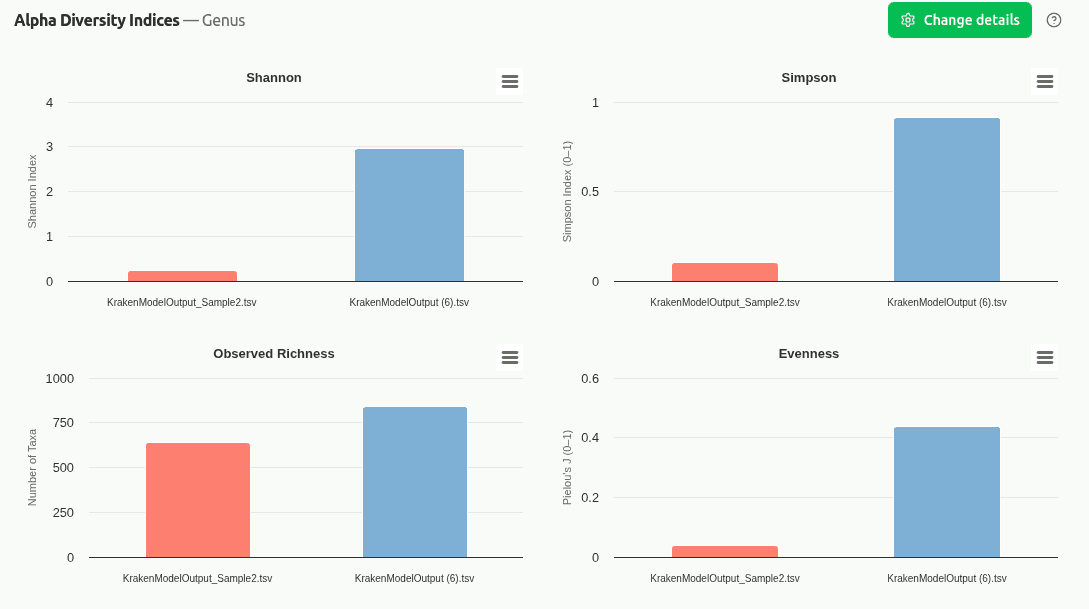
comp-diversity-indices
Multi-panel chart displaying Shannon entropy, Simpson diversity, Observed Richness, and Pielou's Evenness for each sample on its own y-axis scale. Enables quick cross-sample comparison of alpha diversity without scale distortion.
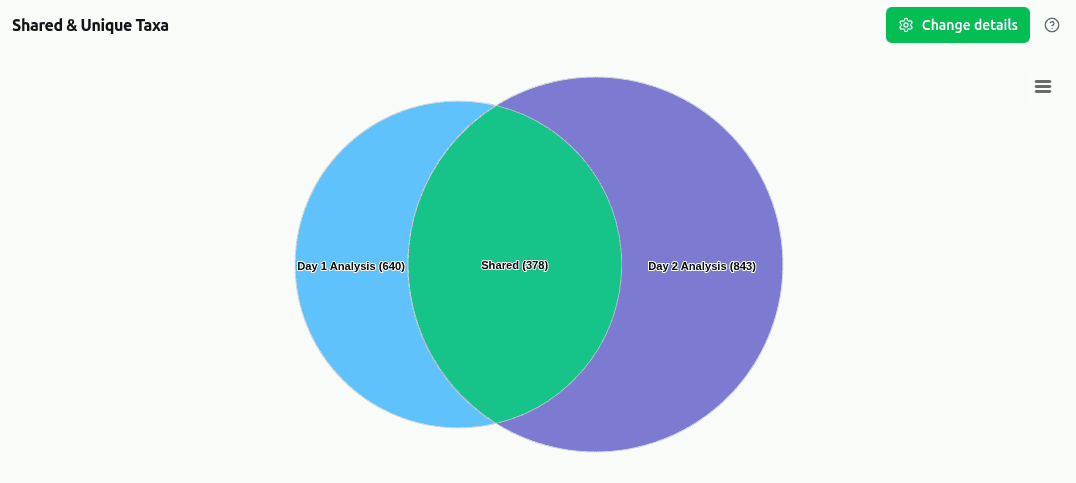
comp-shared-taxa
Venn diagram (2–3 samples) showing the count of taxa that are shared between all samples versus taxa exclusive to each individual sample. Computed at the selected taxonomic rank using presence/absence of clade reads ≥ 1.