DAS Tool
Metagenomic BinningDAS Tool is an automated method for optimizing metagenome-assembled genome (MAG) recovery by integrating the results of multiple binning algorithms. It selects the best non-redundant set of bins from several input binners using single-copy gene (SCG) analysis. [1]
How to Obtain Output Model File
Below is a brief workflow the team ran to obtain the output model examples we present on the tools page.
Input
Contig-to-bin mapping files from multiple binners (TSV) + assembled contigs (FASTA)
Output
TSV with per-bin scores: bin_set (source binner), SCG completeness/redundancy, bin_score, genome size, N50, contig count
conda install -c bioconda das_tool
Docker image: nanozoo/das_tool:latest
Sample 1 activated sludge metagenome (SRR36893531, 24.6M read pairs) assembled with Assembly, binned with MetaBAT2, MaxBin2, and CONCOCT, then optimized with DAS Tool.
- 1
Download reads from NCBI SRA
prefetch SRR36893531 && fasterq-dump SRR36893531 -O /data --split-files && gzip /data/SRR36893531_*.fastq
Illumina NovaSeq X Plus, 2×151 bp paired-end, 24,649,901 read pairs.
- 2
Assemble with MEGAHIT
megahit -1 reads_1.fastq.gz -2 reads_2.fastq.gz -o megahit_assembly --min-contig-len 1000 -t 12
Produces 46,957 contigs, 106.9 Mbp, N50=2,500 bp.
- 3
Map reads to contigs
minimap2 -ax sr -t 12 final.contigs.fa reads_1.fastq.gz reads_2.fastq.gz | samtools sort -@ 8 -o mapped.bam && samtools index mapped.bam
- 4
Bin with MetaBAT2, MaxBin2, and CONCOCT
jgi_summarize_bam_contig_depths --outputDepth depth.txt mapped.bam && metabat2 -i final.contigs.fa -a depth.txt -o metabat2_bins/bin -m 1500 -t 8
Run each binner independently, then convert outputs to contig-to-bin TSV mappings using Fasta_to_Contig2Bin.sh. MetaBAT2: 19 bins, MaxBin2: 29 bins, CONCOCT: 75 bins.
- 5
Run DAS Tool
DAS_Tool -i metabat2.tsv,maxbin2.tsv,concoct.tsv -l MetaBAT2,MaxBin2,CONCOCT -c final.contigs.fa -o dastool/DASToolRun --write_bin_evals --write_bins -t 8 --score_threshold 0 --search_engine diamond
Evaluates all bins from all 3 binners and selects the best non-redundant set using single-copy gene analysis.
DASToolRun_allBins.eval to IntMetaMaterials Used
Charts Reference
Detailed descriptions for all 11 visualizations generated by DAS Tool in IntMeta.

scg-completeness-vs-redundancy
Scatter plot of SCG_completeness (fraction of expected single-copy genes found) vs SCG_redundancy (fraction found more than once), colored by source binner (bin_set column). Ideal bins cluster bottom-right: high completeness, low redundancy. Enables cross-binner comparison.
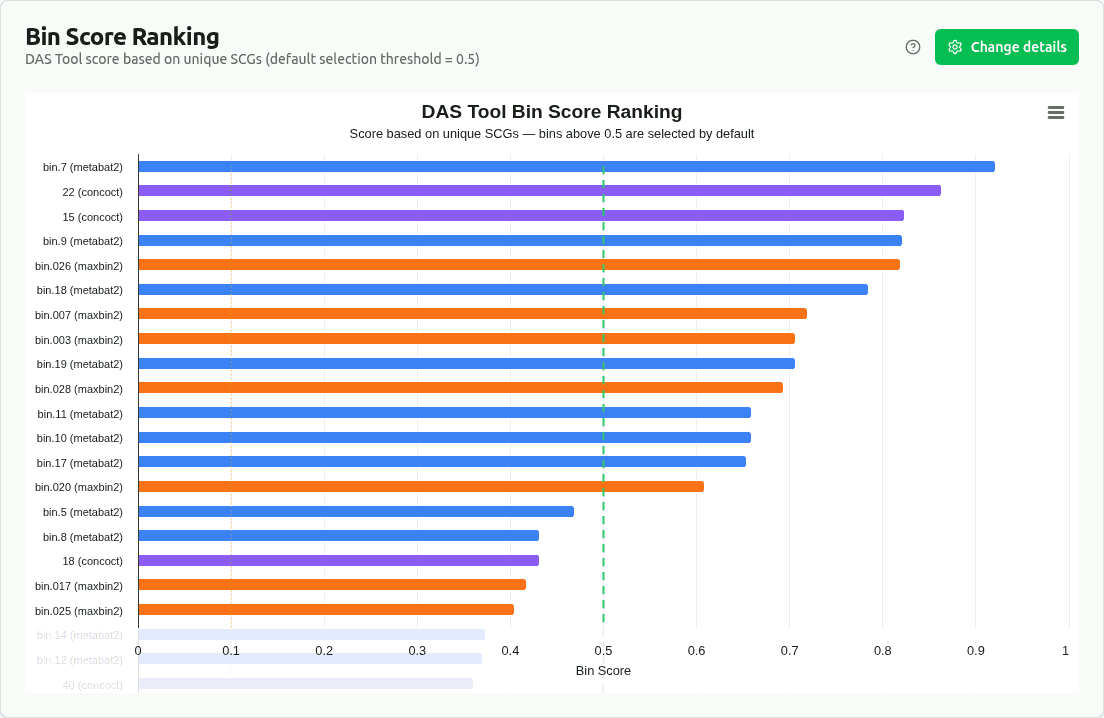
bin-score-ranking
Bar chart ranking bins by DAS Tool bin_score, a composite metric based on the ratio of unique to total single-copy genes. The default selection threshold of 0.5 is shown as a dashed line — bins scoring above it were selected for the final non-redundant set.

cross-binner-quality
Grouped bar chart comparing quality tier distribution (High ≥0.5 / Medium ≥0.1 / Low <0.1 bin_score) across source binners. Reveals which binning algorithm contributes the most high-quality bins to the DAS Tool consensus set.
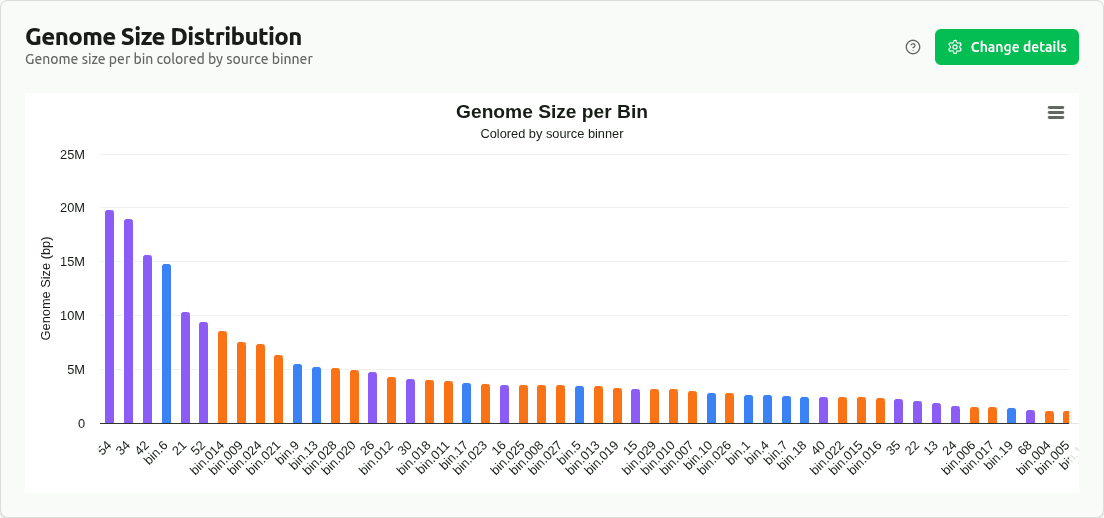
genome-size-distribution
Bar chart of genome size (Mbp, from the 'size' column) per bin, colored by source binner (bin_set). Enables comparison of bin size distributions across different binning algorithms.

n50-vs-genome-size
Bubble plot where X = genome size, Y = N50, and bubble diameter = bin_score. Larger, top-right bubbles represent the highest-quality, best-assembled genomes in the consensus set.
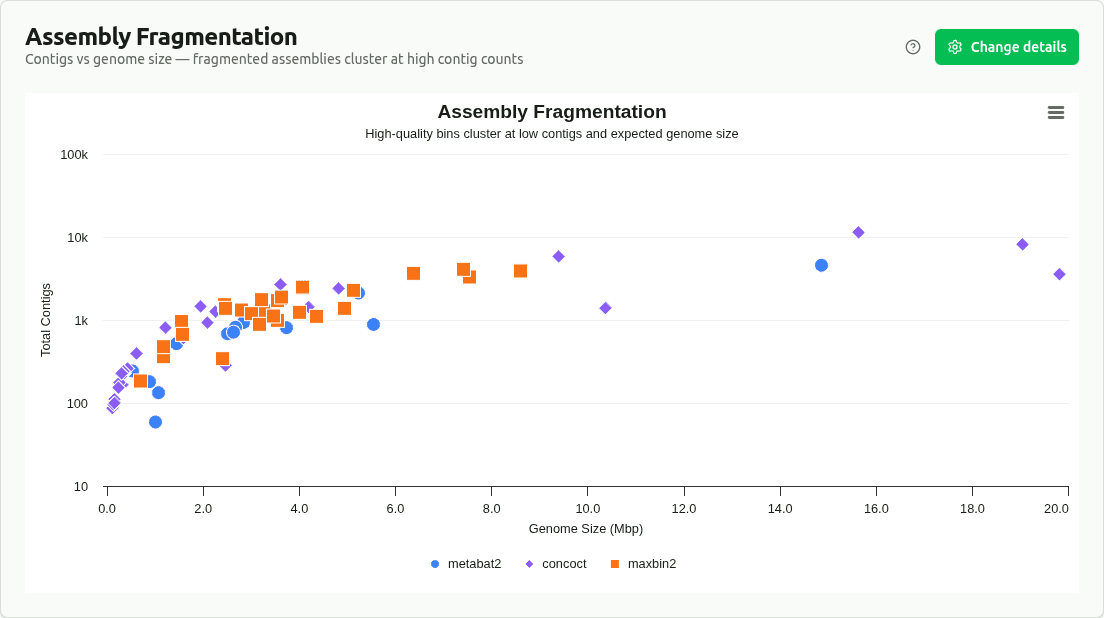
assembly-fragmentation
Scatter plot of contig count vs genome size, colored by source binner. Identifies which binners produce more or less fragmented assemblies — upper-left means many small contigs, lower-right means fewer, larger contigs.
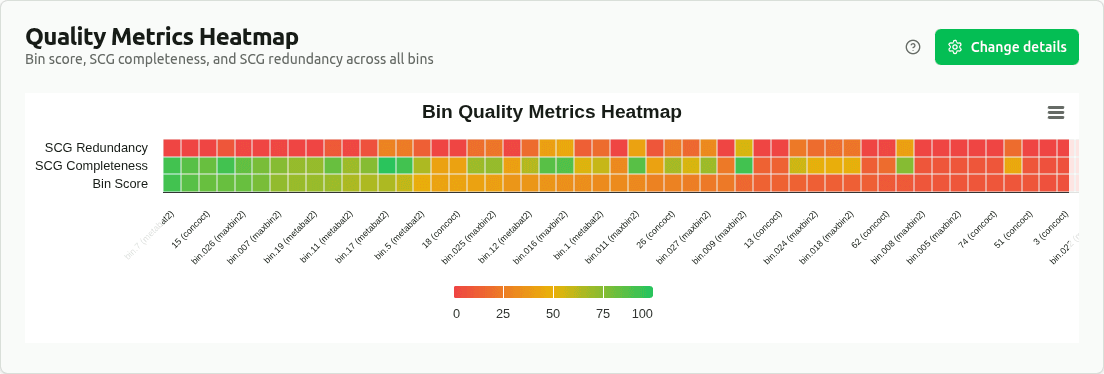
quality-metrics-heatmap
Heatmap of min-max normalized bin_score, SCG_completeness, and SCG_redundancy for all bins. Each metric is scaled 0–1 within its column. Provides a compact overview to quickly identify outlier bins and quality patterns across the dataset.

comp-quality-tiers
Grouped bar chart comparing quality tier distribution (High ≥0.5 / Medium ≥0.1 / Low <0.1 bin_score) across samples. Reveals which sample's DAS Tool consensus set achieved the best overall bin quality.

comp-genome-size
Box plot or grouped bar chart comparing the genome size distribution of DAS Tool-selected bins across samples. Differences may reflect varying community complexity or assembly quality between samples.
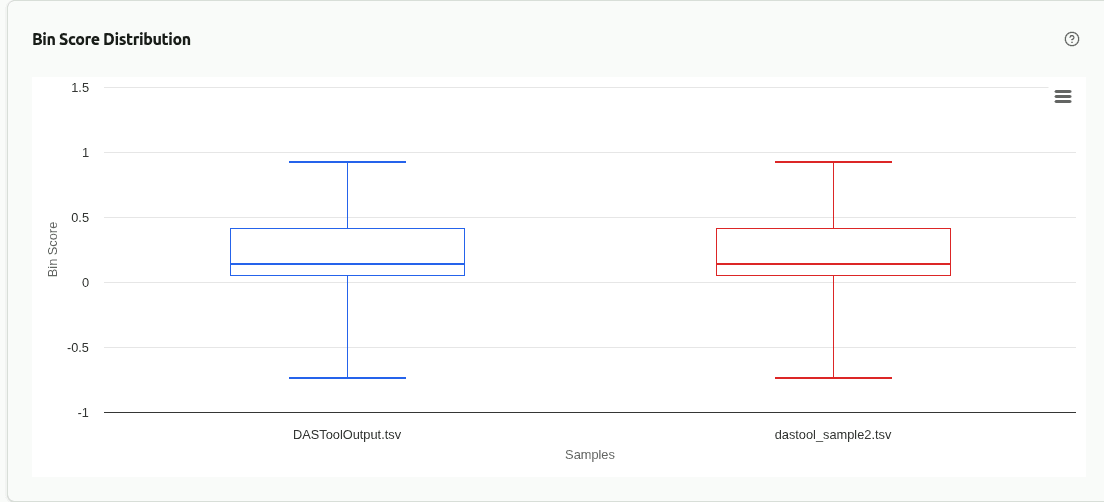
comp-score-distribution
Box plot or histogram comparing the distribution of DAS Tool bin scores across samples. Higher median scores indicate better single-copy gene recovery and less redundancy in the consensus bin set.

comp-binner-breakdown
Stacked or grouped bar chart showing the contribution of each source binner (e.g., MetaBAT2, MaxBin2, CONCOCT) to the DAS Tool consensus set per sample. Reveals which binning algorithm performs best in each sample context.